A new Analysis method for the basketball “Hot-Hand” fallacy
Netzer Bar Am & Shuly Wintner
Department of Computer Science
Statistics
Natural Language Processing
Digital Humanities
PhD Grant 2021
A “hot-hand” is a basketball fans widespread belief that states that a player who has a “hot hand” tends to hit a series of successful shots in a row. In a similar manner, many scientific experiments include a recurrent measurement of a Boolean property (i.e., whose value is either “True” or “False”). Such a repetitive measurement generates a series of Boolean values. In the basketball “hot-hand” context, such an experiment means to write down the successful shots (true values) or misses out (false values) of a basketball player. In this blog post we suggest a new way to analyze a given Boolean sequence and infer if a “hot-hand” phenomenon is supported by the data or is just a myth.
The traditional analysis for the “hot-hand” is to create a two-by-two contingency matrix which counts the number of occurrences of True (hit) followed by a False (miss), True followed by True, False followed by True and False followed by False. A simple Chi-Square test for independence is sufficient to disprove the null-hypotheses (which states there is no dependence between the previous and next results). This analysis focuses only on short-term relations (the next shot only) and might miss a hidden long-term relationships or unexpected periodicity in the data.
In the following analysis method we suggest a new vantage point that focuses on the frequency of the lengths of subsequences of consecutive True values. The null hypotheses predicts an exponential relation between the length of the sub-sequence and the frequency (the longer the subsequence, the less frequent) on a log-log graph. Moreover, the coefficients of the graph can be extracted directly from the portion of true values in the measured sequence. Equipped with this known expected graph, we may compare it to the measured graph. A suggested interpretation of a “hot-hand” on this log-log graph would be a linear line, which means a fat-tail distribution (an over-presence of long sequences in the data). A Chi-Square test can reject (or verify) such an hypothesis.
We developed this method for usage in our study of language mixing in computational linguistics. With this method of analysis we found unexpected phenomena of fat-tail distribution of series in the data.
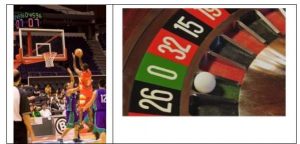
 Do chances of hitting the basket change after a successful shot?
* Netzer Bar Am is a Student of Computational Linguistics at the University of Haifa
** Shuly Wintner is a professor of Computer Science at the University of Haifa

